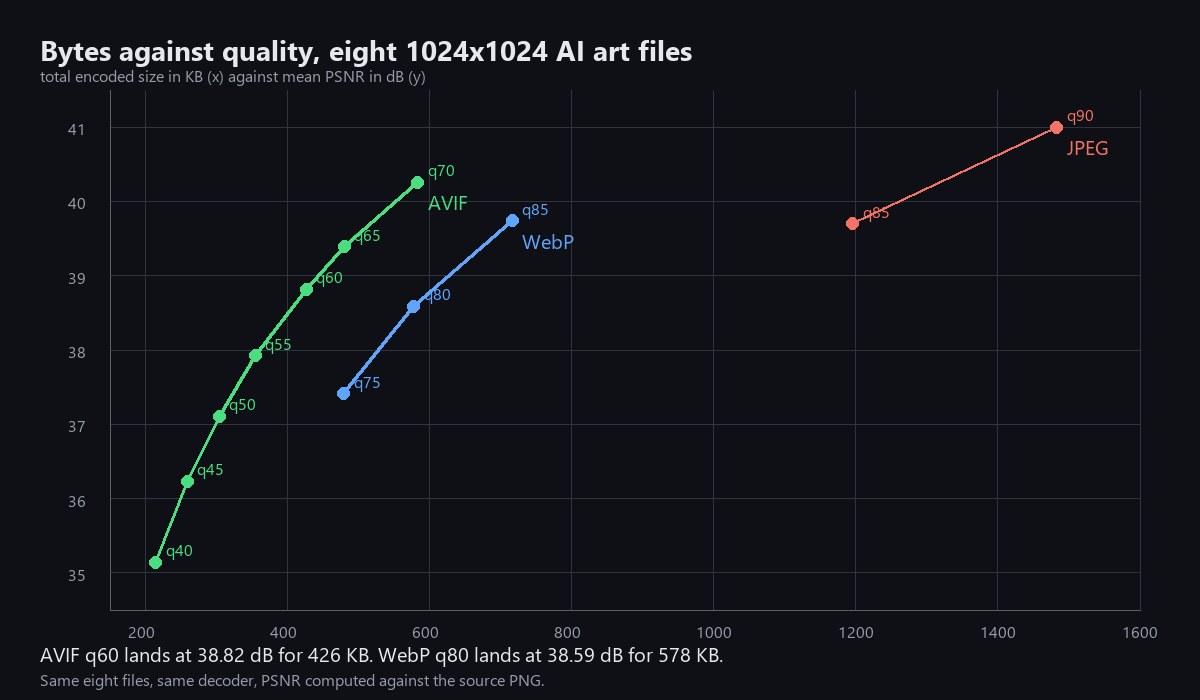
Total encoded bytes on the horizontal axis against mean PSNR on the vertical. Chart generated from the measurement run described below.
Total encoded bytes on the horizontal axis against mean PSNR on the vertical. Chart generated from the measurement run described below.
Eight real files from this gallery, twelve encoder settings, three formats, and one curve. The format everybody already switched to is not the end of the road, and the gap is bigger than the gap that got them to switch in the first place.
The last two guides on this site both ended in the same place. WebP is a large win over JPEG, chroma subsampling is a small one, ship WebP at quality 80 and stop thinking about it. That advice is still correct and it is also now two formats out of date.
So this is the third measurement, and it is the one that changes the recommendation. Same gallery, same discipline, one new format in the comparison.
Eight PNG sources pulled straight off this gallery, every one of them 1024 by 1024 AI output, 8.39 megapixels in total and 10,973,942 bytes of source PNG. Each file was encoded to memory with Pillow 12.3 at twelve settings across three formats: JPEG at 85 and 90 with optimize and progressive on, WebP at 75, 80 and 85 at method 6, and AVIF at every five points from 40 to 70.
Nothing was written to disk, so no filesystem block rounding touches a byte count. Every encoded buffer was decoded back and compared against the source pixels. The quality figure is PSNR in decibels, computed on the mean squared error across all three channels at full resolution. Higher is better. A one decibel gap is a visible gap on a large flat area; a 0.2 decibel gap is not something anyone will see.
| Encoding | Total bytes | PSNR (dB) | KB per megapixel |
|---|---|---|---|
| JPEG q90 | 1,518,583 | 41.00 | 176.8 |
| JPEG q85 | 1,224,210 | 39.70 | 142.5 |
| WebP q85 | 733,382 | 39.74 | 85.4 |
| WebP q80 | 591,572 | 38.59 | 68.9 |
| WebP q75 | 490,342 | 37.41 | 57.1 |
| AVIF q70 | 596,997 | 40.26 | 69.5 |
| AVIF q65 | 491,330 | 39.39 | 57.2 |
| AVIF q60 | 436,675 | 38.82 | 50.8 |
| AVIF q55 | 362,724 | 37.92 | 42.2 |
| AVIF q50 | 311,315 | 37.11 | 36.2 |
| AVIF q45 | 264,640 | 36.23 | 30.8 |
| AVIF q40 | 219,206 | 35.14 | 25.5 |
Read the table by finding two rows with the same PSNR and comparing the byte columns. That is the only comparison that means anything, and it is the one most format arguments skip.
WebP q80 against AVIF q60. WebP lands at 38.59 dB for 591,572 bytes. AVIF lands at 38.82 dB for 436,675 bytes. That is a slightly better picture for 26.2 percent fewer bytes. This is the pair that matters, because WebP 80 is what most galleries actually ship.
WebP q85 against AVIF q70. WebP is 39.74 dB at 733,382. AVIF q70 is 40.26 dB at 596,997, which is 18.6 percent smaller and half a decibel better. Interpolating AVIF down to WebP’s exact 39.74 puts it near 535,000 bytes, a 27 percent saving at genuinely identical quality.
JPEG q85 against AVIF q65. JPEG is 39.70 dB at 1,224,210 bytes. AVIF q65 is 39.39 dB at 491,330. That is 60 percent fewer bytes for a third of a decibel, and AVIF q70 beats JPEG q85 outright on quality while still being 51 percent smaller.
For the record, WebP q80 against JPEG q85 on this set is a 51.7 percent saving, which is larger than the 38 percent measured on the photographic set in the first guide. AI output compresses better than photography in both formats, and it compresses better in AVIF than it does in WebP.
Look at the KB per megapixel column and the shape becomes obvious. JPEG needs 142.5 KB per megapixel to reach 39.70 dB. WebP needs 85.4 to reach 39.74. AVIF needs about 55 for the same place. Every format generation has bought roughly the same thing: the same picture for a bit over half the bytes.
The separation is widest in the middle of the curve, between 37 and 39 dB, which is exactly the band a gallery ships in. Below 36 dB AVIF is still ahead but the pictures are getting soft. Above 40 dB the curves all steepen and the argument stops mattering because nobody serves 40 dB images to a phone.
Encoding time, measured on the same eight files on the same machine, single threaded through Pillow.
| Encoding | Seconds for eight 1 MP files |
|---|---|
| JPEG q85 | 0.54 |
| WebP q80 method 6 | 1.79 |
| AVIF q60 | 1.54 |
That is the surprise. AVIF is not slower than WebP at method 6 on this workload, it is slightly faster. Both are roughly three times slower than JPEG. The individual timings bounced by a couple of tenths of a second run to run, so treat these as the same order of magnitude rather than a ranking, but the folk wisdom that AVIF encoding is punishingly slow does not show up at these settings and these sizes.
Decoding is the real cost and it is not measured here. AVIF decode is heavier than WebP decode on low end phones, and on a gallery page with thirty thumbnails that is a genuine tradeoff against the bandwidth saved. Anyone shipping this should measure it on a real device before switching everything.
The old advice on this site was WebP at 80. The new advice is AVIF at 60 with a WebP 80 fallback. On this gallery that is 436 KB instead of 578 KB for every eight images, a 26 percent cut in image bandwidth for a picture that measures very slightly better.
If you only take one number away, take this one: on AI art, AVIF q60 costs 50.8 KB per megapixel. Everything else on the table is a way of saying that is a good price.